Word-of-Mouth Marketing Statistics: What the Research Shows
Search for word-of-mouth statistics and you’ll find the same two dozen numbers on every page, usually undated, frequently attributed to organizations that no longer exist, and occasionally misquoted badly enough to reverse the finding.
This page takes the opposite approach. Fewer numbers, each with the study and the year attached, followed by the part that matters more for a brand actually building a referral or ambassador program: how to stop borrowing other companies’ statistics and start producing your own.
What word-of-mouth marketing is
Word-of-mouth marketing is any strategy that gets existing customers to recommend a brand to other people — referrals, reviews, ambassador programs, affiliate relationships, and organic social posts. What separates it from advertising is the source: the recommendation comes from someone with no obvious incentive to make it, or with an incentive the audience can see and discount.
The distinction that matters operationally is between word-of-mouth that happens to you and word-of-mouth you can plan around. The first is a byproduct of a good product. The second is a program with recruitment, tracking, and payouts attached.
The findings that hold up
Four pieces of research come up repeatedly and are worth knowing properly, including their age.
Word-of-mouth influences a large share of purchases
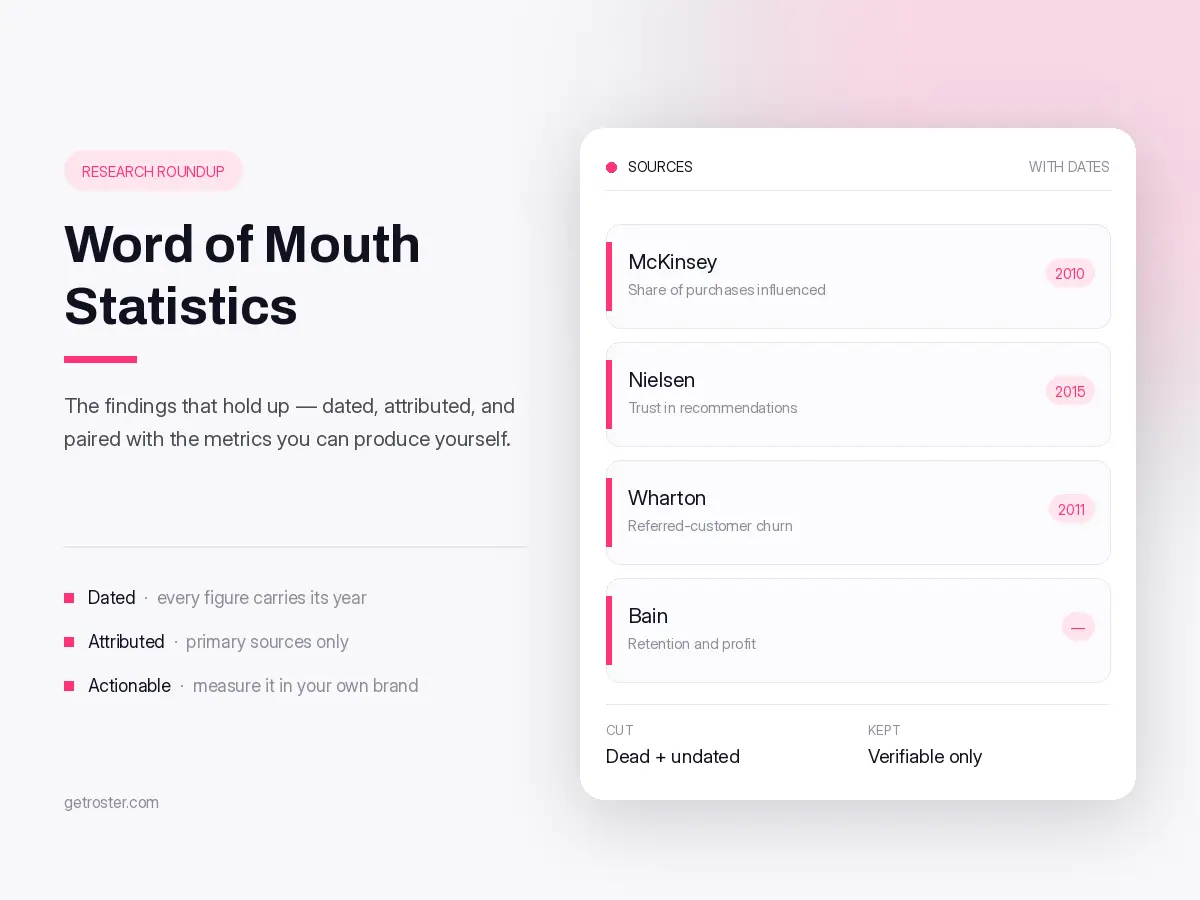
McKinsey: word-of-mouth is the primary factor behind 20% to 50% of all purchasing decisions, with the highest influence on first-time purchases and in considered categories.
This is the most-cited number in the category and it’s now over fifteen years old, which cuts both ways — it predates the entire creator economy, so if anything it understates the current picture. Treat it as directional, not current.
Personal recommendations are the most trusted form of marketing
Nielsen, Global Trust in Advertising: 83% of respondents said they completely or somewhat trust recommendations from people they know, ranking it the highest-trust source measured.
You’ll see 92% and 84% attached to Nielsen elsewhere. Those come from earlier waves of the same study, and pages that quote several of them at once are usually stacking numbers without checking they’re describing the same question.
Referred customers behave differently after they buy
Wharton — Schmitt, Skiera and Van den Bulte: in a study of a German bank’s referral program, referred customers were more profitable and roughly 18% less likely to churn than customers acquired through other channels.
One caveat almost nobody attaches to this finding: some of that gap is selection, not causation. People refer friends who resemble them, and existing customers who refer are already your better customers. A referral program doesn’t transform a bad-fit buyer into a loyal one — it routes you toward better-fit buyers in the first place. That’s still valuable, but it’s a different mechanism than the way this stat usually gets sold.
Retention economics are why any of this matters
Bain & Company, Frederick Reichheld: increasing customer retention by 5% increases profits by 25% to 95%, depending on the business.
The range is the point. You’ll frequently see this quoted as a single number, and any page citing one figure has flattened a finding that was explicitly conditional on the category and cost structure.
How to read word-of-mouth statistics
Since this category is unusually polluted, four filters worth applying to any number you’re about to put in a deck:
- Check the date, then check whether the date is disclosed at all. Most WOM statistics circulating today were published between 2010 and 2017. A page that doesn’t tell you when a study ran is usually a page that didn’t check.
- Check whether the source still exists. Several widely-circulated word-of-mouth figures come from WOMMA, which dissolved into the ANA in 2018, and from companies that folded a decade ago. The number doesn’t become false, but you can’t verify it and neither can anyone who reads your deck.
- Separate research from vendor marketing. A statistic published by a company that sells referral software about the effectiveness of referral software is a marketing claim. It may well be true. It isn’t evidence.
- Watch for correlation sold as causation. This is endemic to referral statistics. Referred customers spend more and stay longer — but the people doing the referring were self-selected as your best customers before any program existed.
Measure word-of-mouth inside your own brand
Borrowed statistics build a business case once. Your own numbers renew the budget every quarter, and they’re better evidence for your category than a 2010 cross-industry average.
Five metrics that can be produced from a brand’s own data:
- Share of revenue from advocates. Orders attributed to ambassador codes and links as a percentage of total revenue. The single number most likely to get a program funded.
- Referred-customer retention delta. Repeat rate of customers who arrived through a code or referral versus everyone else, measured at 90 and 180 days. This is your version of the Wharton finding, on your own cohort.
- Cost per referred customer. Commission, product cost, and program overhead divided by referred orders. Compare it directly against blended paid CAC — this is usually the comparison that ends the debate.
- Advocate participation rate. What share of enrolled ambassadors actually posted or drove an order in the last 30 days. Programs die quietly here long before revenue reflects it.
- Content volume per month. Posts and assets produced by your advocates, which feeds your UGC pipeline and paid social creative.
A note on earned media value: EMV is a reach proxy and a directional trend line, not revenue. Report it in a separate column from attributed sales, and expect finance to discount it heavily if you don’t.
Turning the research into a program
The gap between believing these statistics and benefiting from them is operational. Four steps:
1. Identify who’s already advocating
Most brands have customers posting about them right now and no idea who they are. Before recruiting anyone new, find the people already talking — repeat buyers, high-LTV customers, anyone tagging the brand — and build the program around them.
2. Give every advocate a trackable identity
Word-of-mouth is only unmeasurable when nobody assigns it an identifier. A unique code and link per person converts an unattributable channel into a reportable one, and it doubles as the reward mechanism.
3. Roll it into one view of revenue per person
Advocates drive sales through codes, links, content, and conversations that never touch a tracked URL. A single view of attributed revenue per advocate is what makes tier changes, renewals, and budget decisions defensible.
4. Pay reliably
Advocacy programs churn on payment friction more than on commission rates. Predictable, automated payouts keep people active far more effectively than a higher rate paid late.
Where Roster fits
Roster is the platform brands use to run word-of-mouth as a program rather than a hope: recruiting advocates from the existing customer base, issuing codes and links, capturing the content they create, attributing revenue to individuals, and paying them for it.
Brands including Salomon and Blendtec run their programs on Roster — you can read how in the customer case studies.
Key takeaways
- Most circulating word-of-mouth statistics date to 2010–2017; cite them with their dates or don’t cite them
- The durable findings: word-of-mouth influences a large share of purchases, personal recommendation is the highest-trust source, referred customers churn less, and retention compounds profit
- Referred-customer performance is partly selection effect, not purely program effect
- Your own referral and advocate metrics are stronger evidence than any borrowed benchmark
- Word-of-mouth becomes measurable the moment every advocate has a trackable identity
FAQ
What is word-of-mouth marketing?
Any strategy that gets existing customers to recommend a brand to others — referrals, reviews, ambassador and affiliate programs, and organic social posts. The recommendation carries weight because of who it comes from rather than what it says.
Is word-of-mouth marketing measurable?
Yes, once each advocate has a unique code or link. Some conversation will always be untracked, but the tracked portion is enough to calculate cost per referred customer and revenue per advocate.
Why are so many word-of-mouth statistics out of date?
Because the foundational research was published between 2010 and 2017 and has been recycled across marketing blogs ever since, often without the original date or a working link. Several frequently-cited sources no longer exist as organizations.
Are referred customers really more valuable?
Research indicates referred customers churn less and are more profitable, but part of that difference is selection: your best customers refer people like themselves. The effect is real; the mechanism is usually described too simply.
What’s the difference between word-of-mouth and referral marketing?
Referral marketing is the structured, incentivized subset of word-of-mouth. Word-of-mouth includes everything else — reviews, organic posts, and conversations you never see.
How do I calculate cost per referred customer?
Add commission paid, product cost, and program overhead for the period, then divide by orders attributed to advocate codes and links. Compare against your blended paid acquisition cost for the same period.
How many ambassadors does a program need?
Fewer than most brands assume. Participation rate matters more than roster size — fifty active advocates outperform five hundred enrolled and dormant ones.
Build your own word-of-mouth numbers
Roster gives DTC brands one place to recruit advocates from their customer base, track what each one drives in revenue, capture the content they create, and pay them for it. If your brand is doing $1M+ in revenue or has 10,000+ customers, book a 30-minute demo and we’ll walk through how brands structure and measure advocacy programs.