
Performance dashboard
See what your program actually returned
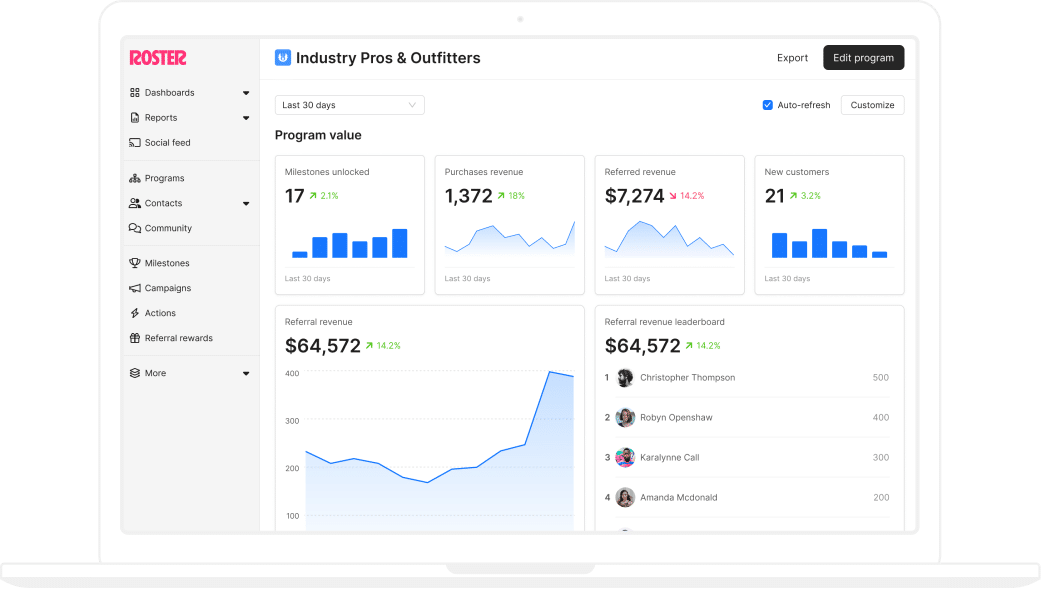
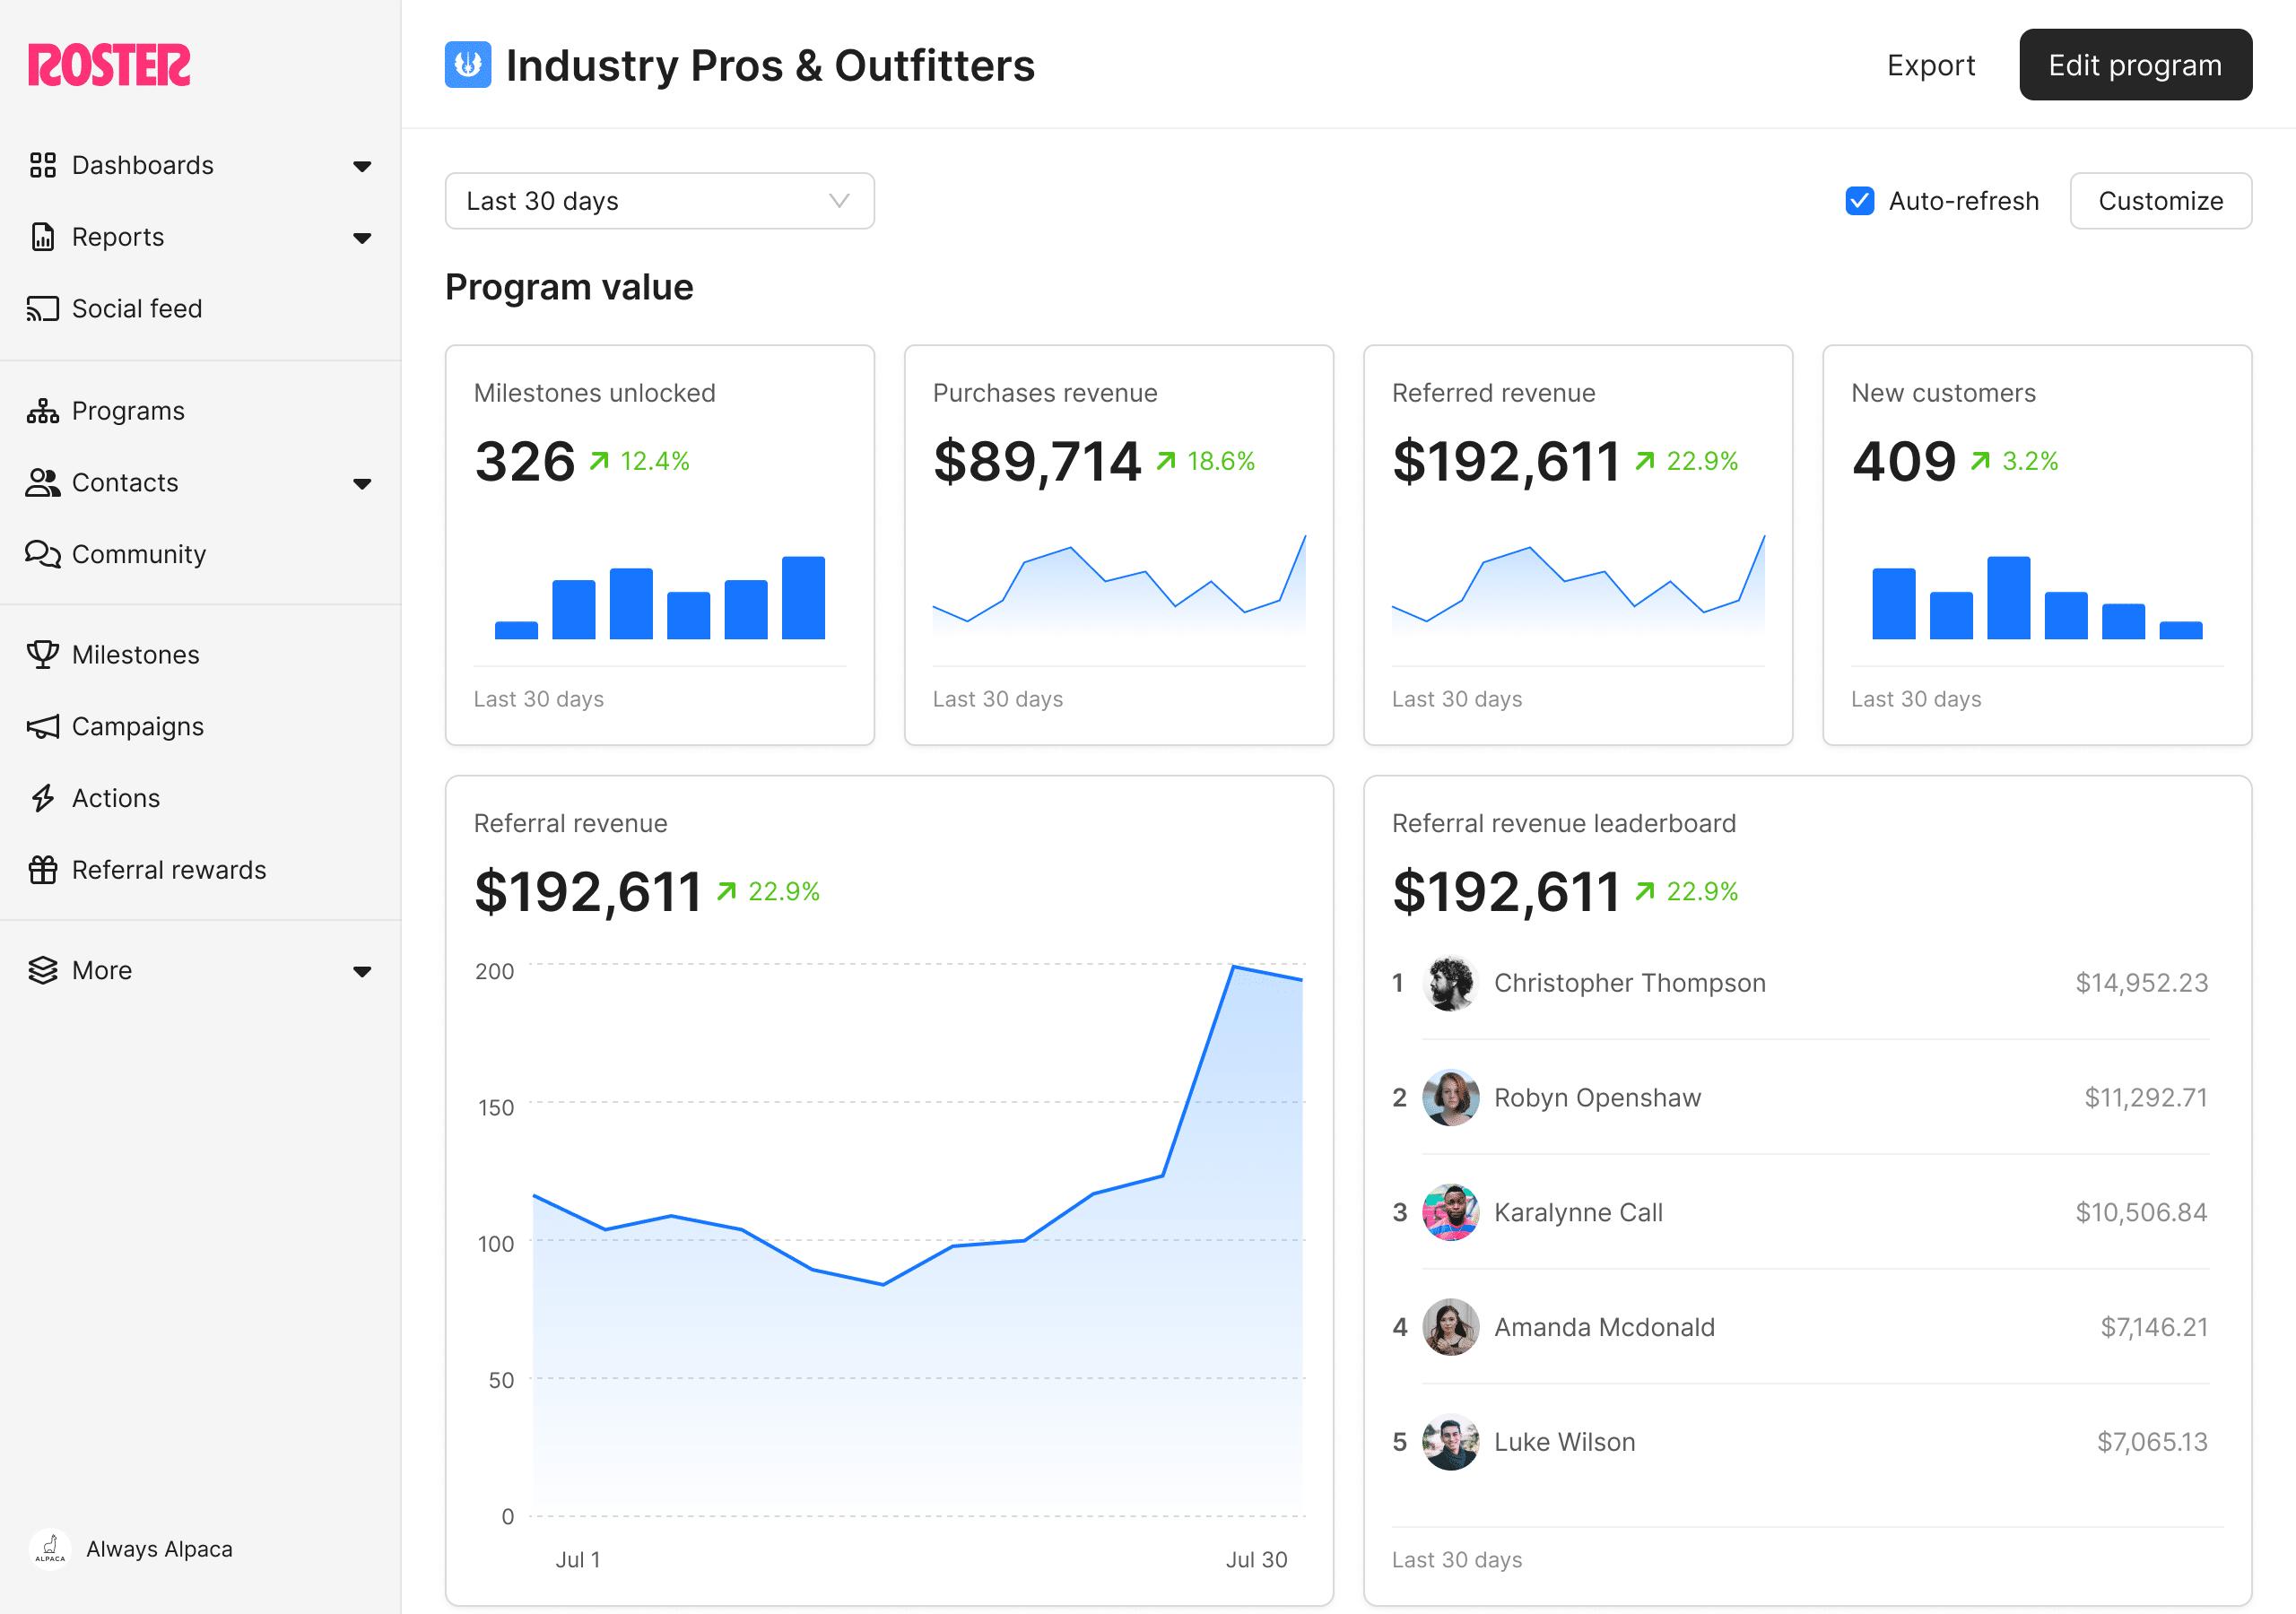
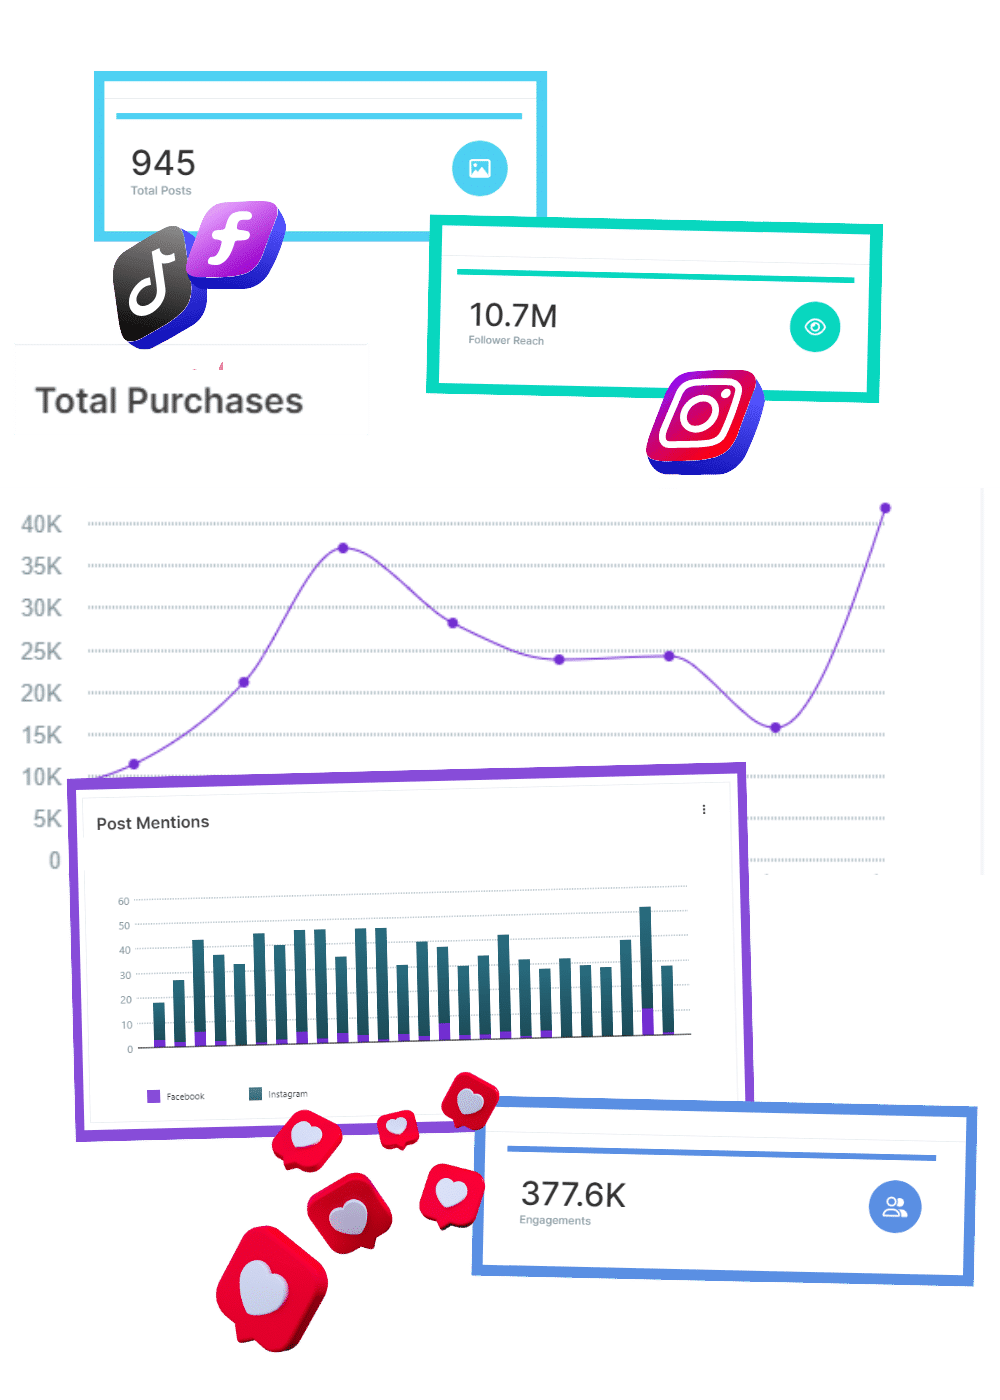
A customizable brand-level dashboard plus a dedicated dashboard for every program — referred revenue, link clicks, posts, reach, engagement, and earned media value, over any date range.
Rearrange the cards. Export the data. Compare programs.
Ambassador programs get cut because nobody can defend them
Not because they do not work, but because the number was never assembled.
Revenue and reach live apart
Sales sit in Shopify, content sits on Instagram, and no one joins them into a single figure.
No per-program view
If ambassadors, creators, and affiliates report as one blob, you cannot tell which one is carrying the others.
Reporting takes a week
If assembling the number is a manual project, it happens quarterly at best, and by then decisions are already made.
How reporting is structured
Two levels, and everything exports.
Brand performance dashboard
Aggregated across every active program, with default cards you can add to, remove, reorder, and group into sections. Set the date range and the whole view follows.
Program dashboards
Each program has its own, configured independently, so an affiliate program can foreground commission while an ambassador program foregrounds reach and content.
Reports underneath
Sales attribution, referred orders, personal orders, social posts, and campaign performance, each filterable and exportable when you need the detail behind a number.
What you can see
Customization
Build the view your team argues about
Cards can be added, removed, reordered, and organized into sections, then saved. Different programs can foreground completely different metrics, which matters when the programs have different jobs.
Program dashboards export directly, so the monthly reporting task becomes a download rather than a rebuild.
Comparison
Set one thing against another
The social posts comparison report lets you define two groups and compare them directly — program against program, quarter against quarter, or campaign against campaign.
That is usually the report that settles an internal disagreement, because it removes the argument about which baseline to use.
Also available
Ask your dashboard a question in plain English
Roster connects to Claude, ChatGPT, and other assistants through a read-only Model Context Protocol connector. It reads the same reports the Brand Portal shows, links back to the exact portal page for every answer, and can never modify your data. Currently in closed beta — ask your CSM about access.
The four numbers to watch
What most mid-market brands report upward.
Referred revenue
The headline. Revenue attributed to ambassadors in the period.
New customer share
How much of that revenue is acquisition rather than existing customers.
Earned media value
The reach side, priced against what paid media would have cost.
Cost to serve
Commission, product, and platform against the two lines above.
Program dashboards let you compute all four separately for each audience you run.
Related features
Questions brands ask
Can we customize what the dashboard shows?
Yes. Add, remove, reorder, and group cards into sections at both brand and program level, then save the view.
Is there a per-program view?
Yes. Every program has a dedicated dashboard configured independently of the brand-level one.
Can we export?
Yes. Dashboards and reports export, and campaign performance exports to PDF for sharing.
Can we compare two periods or programs?
Yes, through the social posts comparison report, which supports two defined groups with their own filters.
Where does earned media value come from?
Impressions and engagement multiplied by CPM rates you set per network and post type, using network data where available and labeled estimates where not.